
City Compensation

Your Competitive Edge in the Government Talent Market place – The Data You Need to Recruit, Pay, and Retain Talent Smarter.
Stay ahead of local government compensation trends
Use our best-in-class, nationwide dataset to guide your compensation decisions
Better Data -> Better Insights -> Better Decisions
Power Your Workforce Strategy with Unrivaled Compensation Intelligence
- City Compensation delivers actionable intelligence that transforms how you retain and attract public service talent.
- Stop guessing what competitive compensation looks like or using limited peer city data.
- Start making decisions based on updated comprehensive data
Why City Compensation
Public Sector Compensation, Hiring, and Retention is Outdated and Broken. We Are Here To Fix That.
Tailored for the Public Sector
Built to address the unique needs of government organisations
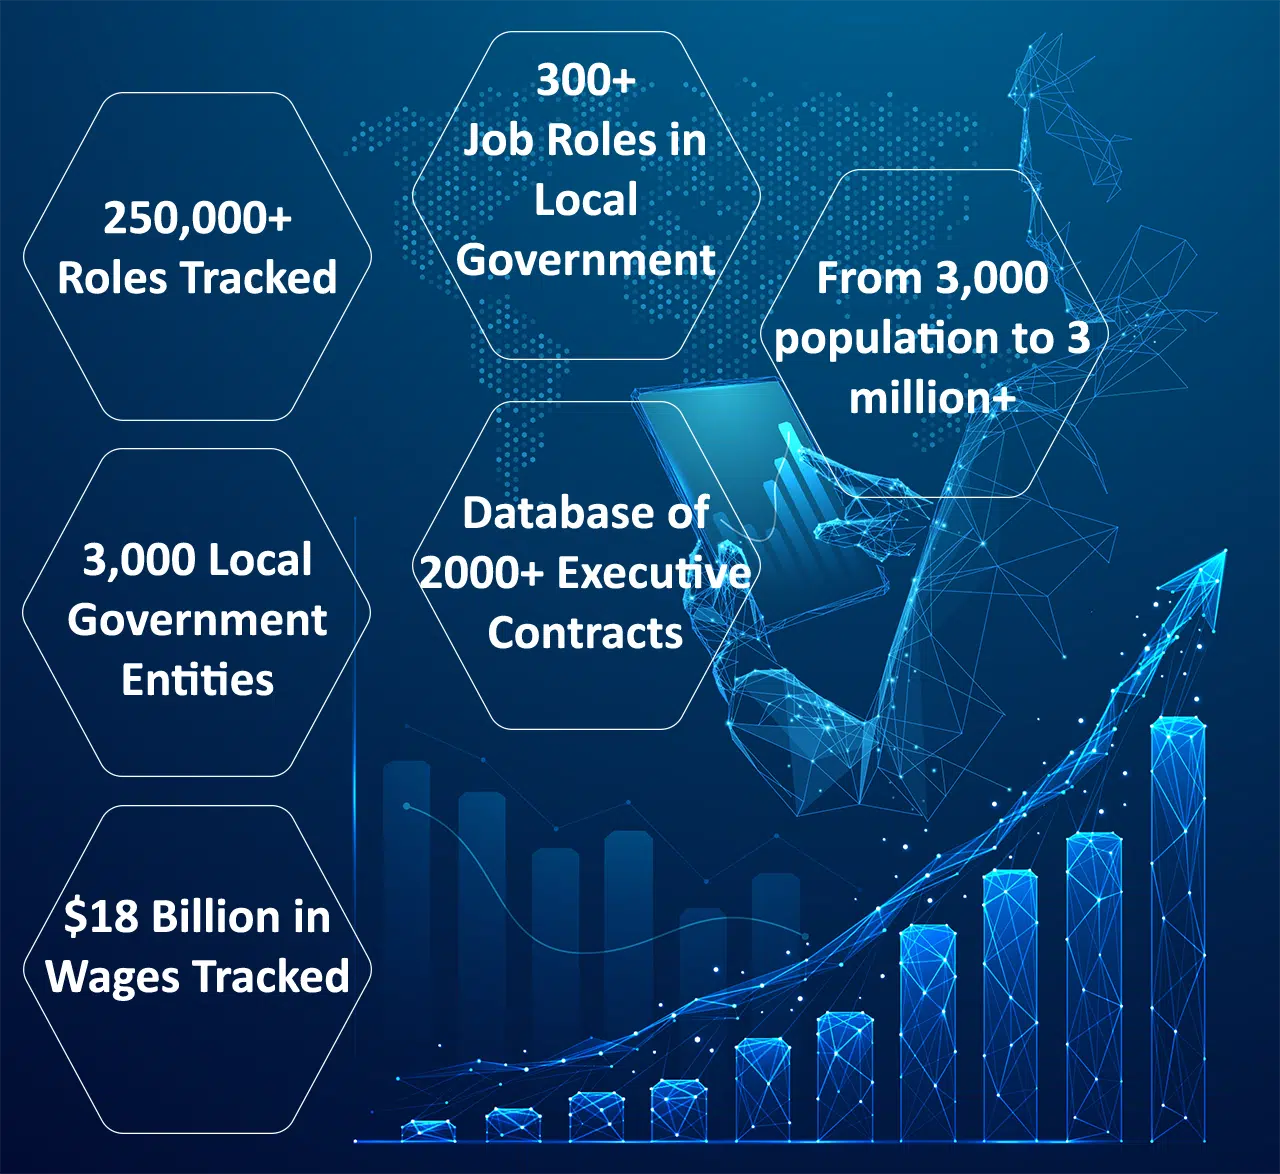
Start making decisions based on comprehensive data from over 3,000 cities and counties nationwide
Real-Time Data & Insights
Empowering HR teams with advanced tools and real-time data
Stop guessing what competitive compensation looks like or using limited peer city data
Actionable Analytics
Turn workforce data into smarter decisions for better outcomes.
City Compensation delivers actionable intelligence that transforms how you retain and attract public service talent
Proven Expertise
Trusted by agencies nationwide to enhance talent management.
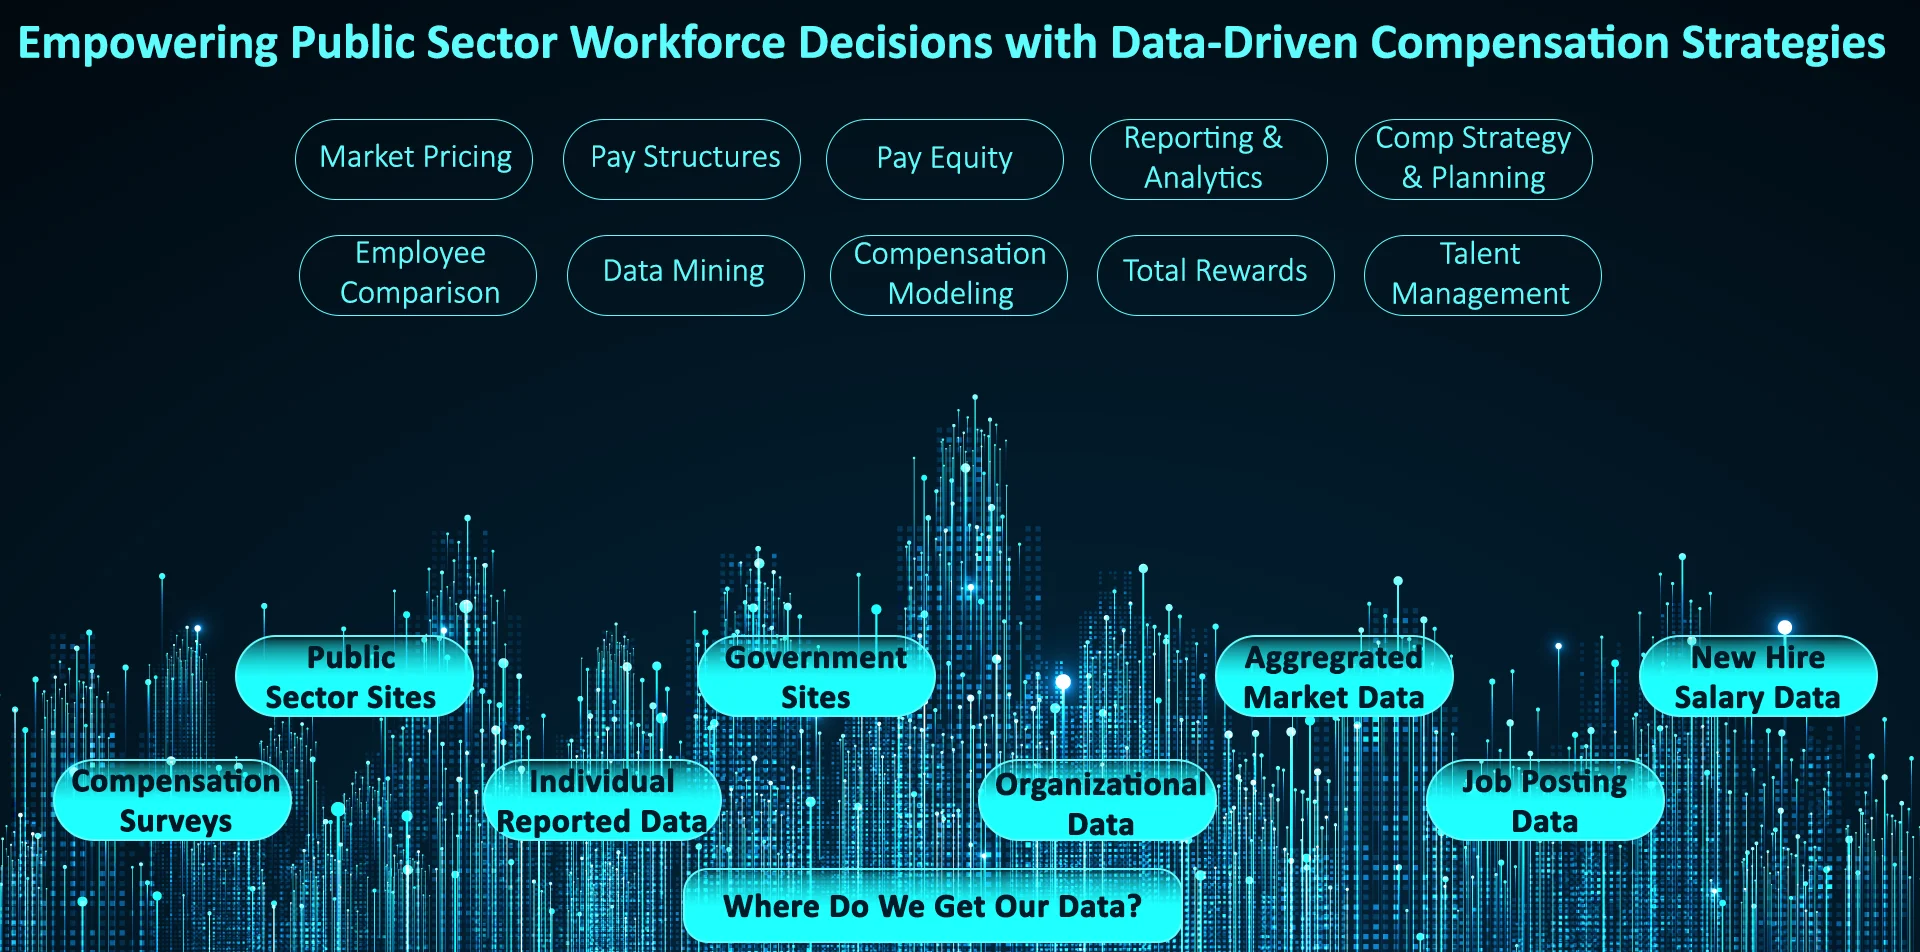
The most comprehensive data compiled from clients, government sites, salary surveys, individual responses, job posting data, and aggregated market data.
Deep Market Intelligence
Ensure your salaries remain competitive in a rapidly changing job market.
City Compensation helps you benchmark pay structures against verified data from thousands of cities, ensuring you attract and retain top talent while staying within budget
Easy-to-Use, Powerful Platform
Designed for HR teams, by HR professionals.
With an intuitive interface and customizable reporting tools, City Compensation makes it easy to analyze compensation trends, compare job roles, and present data-driven recommendations to leadership.
Key Reasons
Turn Our Deep Data Into Your Competitive Advantage
1. Make Irrefutable Cases for Budget Approval
Back your compensation proposals with precise market comparisons that governing bodies quickly understand and appreciate.
2. Recruit Top Talent Faster
Identify the precise compensation ranges needed to attract qualified candidates in today’s competitive market
3. Retain Your Most Valuable Team Members
Proactively address compensation gaps before your best people start looking elsewhere
4. Streamline Compensation Negotiations
Enter discussions for raises or recruitment with complete market knowledge across all position levels
5. From Benchmarking to Action in Minutes, Not Months or Years
Our intuitive platform transforms complex nationwide data into clear, actionable insights tailored to your specific needs.
Ready to revolutionize your compensation strategy?
Get started today and see why forward-thinking local governments trust City Compensation to build teams that deliver exceptional public service
City Compensation helps you Gain a Competitive Edge in the Fierce Talent Market while building a more fair, equitable, and transparent pay strategy
Use Cases

1. Hard-to-Hire positions analytics
A community engaged with City Compensation to review compensation trends for “hard-to-hire” positions and re-setting its compensation strategy. Within hours, this community had advanced analytics for each position and deep understanding of current compensation trends for their Building Inspectors and 911 Dispatcher roles.
2. City Manager contract analytics
A City Council engaged with City Compensation to present compensation and contract trends for its appointed officials. Our nationwide contract dataset quickly assisted the City Council in understanding trends in their area, as well as statewide. The result, a new contract for their city manager to ensure their compensation is dependable and aimed at long-term retention of their city manager.
3. Leadership Team Compensation
Many cities have used City Compensation to run deep dive reports on their leadership teams to understand pay equity for position titles. For example, one city quickly realised one department head was paid at the 25th percentile of the position compensation in their state, while other department heads were paid at the 75th percentile or higher. This internal pay equity issue was identified.
4. Compensation Strategy on Recruitment
A city in a major metro area had posted for a Procurement Manager at a posted salary range of$85,000-$111,000. We were able to quickly show the incumbent salaries for the cities within the metro area to be $114,691 to $126,300, limiting their ability to recruit talent within the marketplace.
Want to talk more about your Use Case?
Client Testimonials
Frequently Asked Questions
Frequently Asked Questions – City Page
How often is the compensation data updated?
Our dataset is updated continuously throughout the year. We collect fresh information from a portion of our 3,000+ government entities each month, maintaining the nation’s most comprehensive local government compensation database.
Which government entities are included in your database?
Our database contains information from over 3,000 local government entities with populations from 2,500 to 8 million. Entities are included from all 50 states.
Is this information already publicly available?
While some states maintain transparency portals with annual city datasets, these sources offer inconsistent collection, reporting, and infrequent updates. Our platform provides more comprehensive, regularly updated information.
How do you ensure the accuracy of your compensation data?
We maintain data integrity through a multi-layered quality assurance process that includes:
– Validation at all data entry points
– Automated consistency checks
– Comprehensive data profiling
– Regular auditing procedures
Why might there be discrepancies between your data and other public sources?
Common public sources often report partial-year compensation or include post-employment benefits, creating misleading figures. For example, a Fire Chief hired mid-year might appear underpaid in standard reports, or departing employees with severance packages might appear overpaid.